
Have you ever wondered which direction to take your content marketing?
After finishing up my most recent series of blog posts, I had to make a decision on which direction to take my next series. In addition, it was time to perform an analysis of my overall strategy during the past year.
I needed a method of digging up answers to the following questions:
- Which posts of mine have done well in the past?
- Which posts by others in my space are the most popular?
- Which social networks are most popular for sharing posts amongst my target audience? Am I spending my energy on the right networks?
- What types of posts are the most popular? How-to’s? Sharing lessons learned? List-style articles? Reviews?
Fortunately, I discovered a few methods that allowed me to analyze 1,028 blog posts in my subject areas (SaaS and Entrepreneurship). By combining several tricks I was able to unearth a few key takeaways that will shape the future of my writing, at least in the near term.
What’s great about these methods is that they can be applied to any blog, in any subject area. The insights gained from the results can help any business marketer make smarter decisions about their content marketing strategy.
”Without strategy, content is just stuff, and the world has enough stuff.”
Arjun Basu
The Strategy
To answer the questions I mentioned previously, I knew I needed to dig through a lot of posts both from my blog and other’s blog and determine how popular each article was on social media.
It would have also been helpful to load up the comment count for each article, but since some sites use WordPress comments, while others use Disqus or Facebook comments, it is difficult from a programmatic standpoint to get an accurate count of comments across a variety of blogs.
So, to discover the popularity of a wide variety of articles in my space, I followed these steps:
- List 10 blogs that I want to target to analyze in my space.
- Populate a spreadsheet with their most recent article titles and URL (approx. 100 each).
- Look up the engagement for each post on Twitter, LinkedIn, Facebook, and Google+.
- Add up the total social engagement across sources, and sort the spreadsheet accordingly.
Now, done manually, this would take weeks. Don’t worry, I’m going to share the free tools that I used to accomplish this in about an hour.
Note: You could also use Buzzsumo to gain similar data, but with this level of granularity you would need a paid plan which starts at $99/month.
As a bonus, using conditional formatting in my spreadsheet, I was able to highlight every post that originated from my site, to quickly spot where on the list my previous articles ranked amongst my peers.
Why it Matters
Some may argue that social shares are not necessarily a good determining factor. After all, you can spend $5 and purchase 3,000 tweets for any article on fiverr.com.

Also, some authors have been blogging for so long that they are going to garner many times more shares than a relative newcomer, even though the articles on the newcomer’s site might be more engaging and interesting.
Because of these concerns, I chose my list of 10 blogs to target based on the following:
- They were trustworthy sites, with no evidence of social share hacking (like getting 3,000 tweets immediately after publishing).
- They were of similar quality.
- They have each been around at least a year, preferably two.
By using these criteria when choosing my blogs to analyze, I ended up with what appears to be reliable data on the popularity of certain posts.
The Results
If you jumped down to this section because you were just curious about the end results, here you go:
SaaS-Related Blogs Spreadsheet Analysis
If SaaS is not of interest to you, feel free to skip down to the “How I Did It” section below.
The blogs that I targeted in this analysis were (alphabetically):
- A Smart Bear
- Close.io
- For Entrepreneurs
- Groove
- Kissmetrics
- LeadFuze
- OpenView Partners
- Ryan Battles
- Sixteen Ventures
- Tom Tunguz
These blogs represented an array of topics that are of interest to me and my audience, with a heavier focus on SaaS. These blogs cover:
- Sales
- Email Marketing
- Content Marketing
- Reducing Churn
- Customer Acquisition
- Entrepreneurship
- Pricing Strategy
Some blogs are more “bootstrapper-friendly”, while some are more geared towards VC-backed startups. My blog made it in there, of course, so I could analyze my previous writing and how it stacked up in the general space.
To my surprise, I noticed that once I sorted by social shares, my blog stacked up quite respectfully with the others that I look up to as industry leaders.
Key Takeaway #1: I need to have more confidence in myself as a writer. When sorting by most tweets, 3 of the top 10 blog posts are my own. Granted, a lot of this comes from the fact that they were picked up by Buffer as suggested tweets, but the fact remains that they are highly shared and ranked well by search engines.
Armed with this spreadsheet, I was also able to total up social shares by the network as a whole and determined where my potential audience tends to hang out.
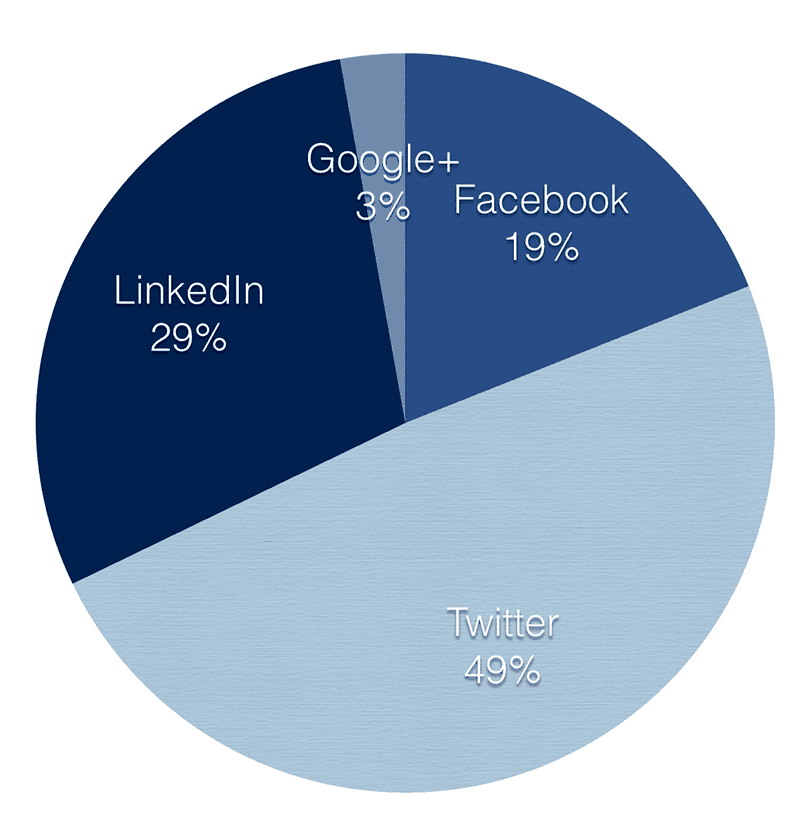
Key Takeaway #2: Twitter remains king with 49% of the total shares, while Google+ seems to be a side-note with only 3% of the shares. Neither Facebook nor LinkedIn should be ignored, however, as together they rival the Twitter shares at a combined 48% of the shares.
Looking back at my sharing records, I noticed that I do not have anywhere near the 19% share rate on Facebook that others are experiencing.
Key Takeaway #3: My Facebook engagement is abysmal compared to others in my space. I need to strategically lift this engagement and take Facebook more seriously. One small change that I have made is to build a custom thank you page after people sign up for my newsletter, with a strong call to action to join me on Facebook. As a result, a week after that change I had a 1,460% increase in post reach on Facebook.
Another insight I hoped to gain was figuring out what types of blog posts were most shared. Was it posts that shared insight? Survey-type posts? Reflection on experience?
Here are the results:
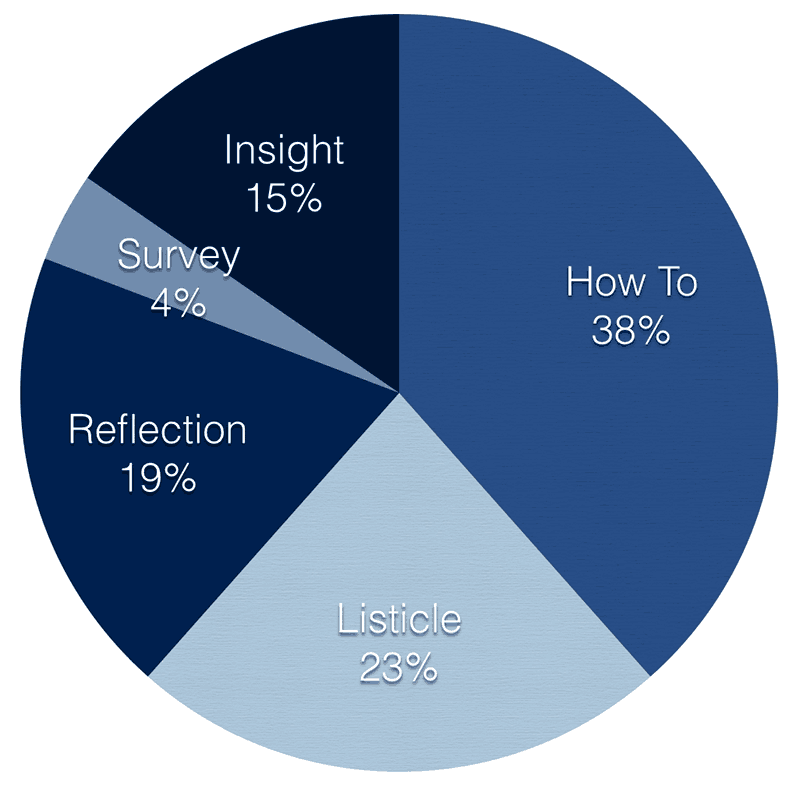
- How-To: 38%
- Listicle: 23%
- Reflection: 19%
- Insight: 15%
- Surveys: 4%
I tend to lean towards how-to articles while staying away from listicles because they seem so gimmicky (The 10 secrets about X that Y doesn’t want you to know). However, they certainly are shared a lot, and also tend to rank nicely in search engines.
Key Takeaway #4: Stay the course, but don’t be afraid of a listicle every once and a while.
Finally, the last insight I hoped to gain was a word count of the articles that were most shared. Do people tend to share long or short content? About how many words is the average shared article? To find this out I manually pasted the top few dozen articles into a word count tool.
Key Takeaway #5: Favor long content. The average word count of the most shared posts was over 3,000 words. If I combine articles into eBooks to sell on Amazon, then 10 posts plus some additional commentary to weave it all together will equal about a 40,000-word book, the sweet spot.
Of course, your takeaways will be different as you’ll be analyzing different blogs, noticing unique patterns, and perhaps even looking for different metrics. However, the methodology is the same, and that’s what we’re going to dive into next.
How I Did It
So how do you fill a spreadsheet with 1,028 blog titles, URLs, and social share counts without killing a week of work or hiring a virtual assistant? You leverage technology!
Note, I learned the basis for this method from the excellent book, Becoming a Technical Marketer: A Guide to Working Faster, Accelerating Growth, Automating Marketing Tasks, and More by Justin Mares and Nathaniel Eliason. It’s only $2.99 for the Kindle book, a great deal for the insight you’ll glean.
Step 1: Scrape the Blogs with Import.io
Using Import.io, you can enter any of the blog’s listing page URLs, and will instantly be presented with a table-formatted listing of article titles, URLs, and other useful information.
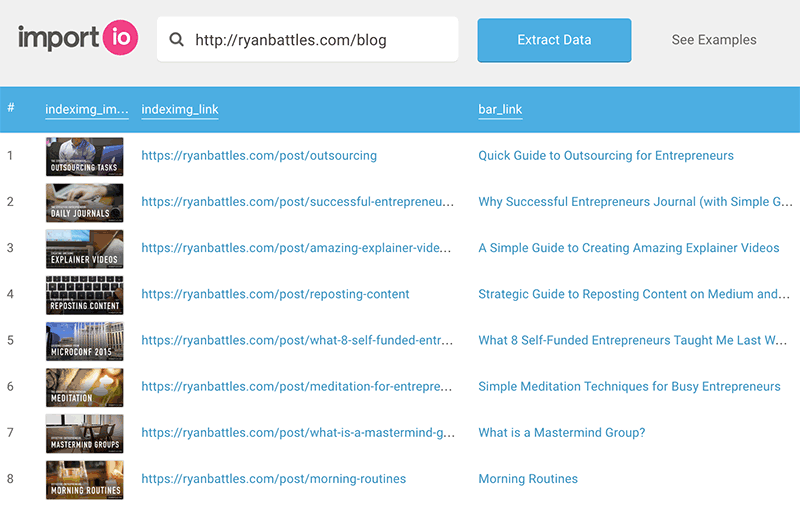
You can also download the results as a CSV, which is what we are going to do for this exercise. The tool allows you to download up to 20 pages from the blog listing when saving a CSV, so that ends up being about 200 of the most recent posts on any blog.
After this exercise, you’ll have a handful of CSVs. Now, they’ll all have slightly different formats, since a lot of misc. information is also scraped with the titles and URLs. To simplify things a bit, I just opened each CSV in Numbers as a spreadsheet and formatted them like so:
- Title
- URL
That’s it! The social sharing part will come in later, for now, we only need those two columns.
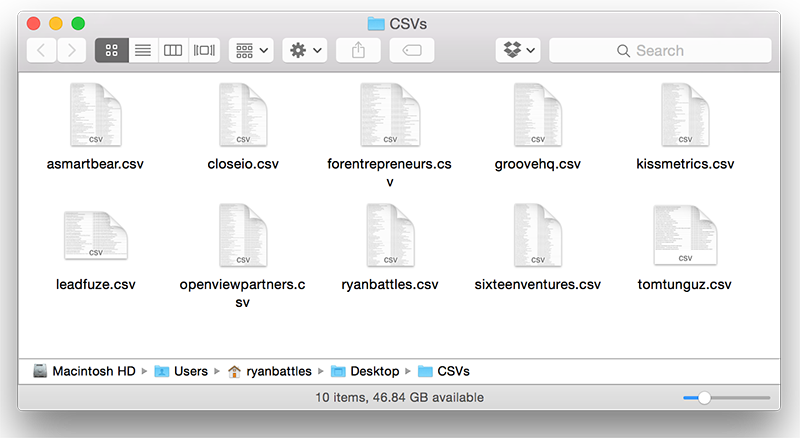
Finally, you can either manually combine these separate CSV files into one list, or if you’re on a Mac, you can do the following:
- Place them all in one folder on your desktop called “CSV”.
- Open Terminal (in your Applications folder) and type in cd /Desktop/CSV
- Finally, type in cat *.csv >merged.csv “ to merge all of the CSVs into a new one called “merge.csv”.
Now they should all be combined into one new CSV file. Go ahead and open this file with Excel (or Numbers), and save it as a standard. XLS Excel file. This will be used in step 3.
Step 2: Register a SharedCount API Key
This step involves signing up for a free plan at sharedcount.com: https://admin.sharedcount.com/admin/signup.php
This requires you to confirm your email address to receive an API key, which you will need in the following step.
Step 3: Use OpenRefine to Grab a Thousand URLs at Once
At the time of this writing, OpenRefine is in beta for the 2.6 release, but this has been the case for about two years now, so I think it is safe to say that it will be in beta for a while. Let’s just use it!
Go to https://github.com/OpenRefine/OpenRefine/releases/tag/2.6-beta.1, or search for OpenRefine in Google if that link is no longer works.
For the Mac version, I had no trouble installing version 2.6 on my Yosemite machine, but once I opened the app, nothing seemed to happen.
After installing OpenRefine, you have to navigate your web browser to http://127.0.0.1:3333/
You should then see a screen like the following:
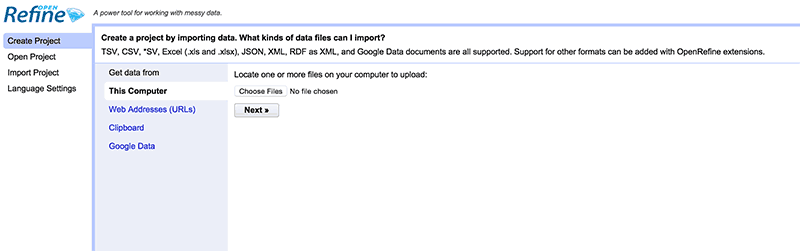
What you’re going to want to do here is create a new project, and import the excel file that you created in step 1.
Once the spreadsheet is open, you can click on the dropdown arrow at the top of the URL column, and go to “Edit Column > Add column by fetching URLs…”
The next steps are:
- Give that column a name (it doesn’t matter what, I used “Social Shares”.
- Set your throttle delay to 1ms from the default.
- Use this URL in the “Expression” box:
‘https://free.sharedcount.com/?apikey=APIKEY&url=’ + value
Swap out APIKEY in the above URL with your actual API key from the shared count.
You should now have a new column with a long string of social share information. In the next step, we’ll make sense of this data and separate them by social networks.
Step 4: Use OpenRefine to Parse a Thousand Strings at Once
OpenRefine helps you to become a Spreadsheet ninja (haven’t you always wanted to become one?). For this next step, select the dropdown triangle at the top of your social share column that you just created and select “Edit Column > Add column based on this column…”
We’re now going to tell OpenRefine to parse the data into a new column.
Name this new column “Twitter”, and paste this as the expression: valueparseJson()[“Twitter”]
You can repeat this step a few more times, gathering other networks with these expressions:
- Facebook: valueparseJson()[“Facebook”][“total_count”]
- LinkedIn: valueparseJson()[“LinkedIn”]
- Google Plus: valueparseJson()[“GooglePlusOne”]
After these steps, you can export your project from OpenRefine into a new spreadsheet for our final analysis.
For my spreadsheet, I deleted the Social Shares column since the data was now written into individual columns per network, and used a “SUM” equation to add up the social shares into a new column called “Total”.
Moving Forward
Armed with this data, you can discover the answers to a lot of the questions that I proposed at the beginning of this article. It also provides a handy swipe file for brainstorming effective headlines for future posts.
Remember, however, to see this information for what it is worth. It is a history of what has worked for other blogs in your desired space, but only by providing the title of these posts. Numerous other factors go into the popularity of a blog:
- The uniqueness of the content
- The voice of the author
- The consistency of writing
- The relevancy of topics from month to month
- The marketing ability of the author
- The platform the author might already have from other products
This exercise is just one step in analyzing a content marketing strategy, but it is an important one that can provide a lot of key insights that provide key takeaways for you to implement moving forward.